 Interpreting a Bar Chart, Football Theme
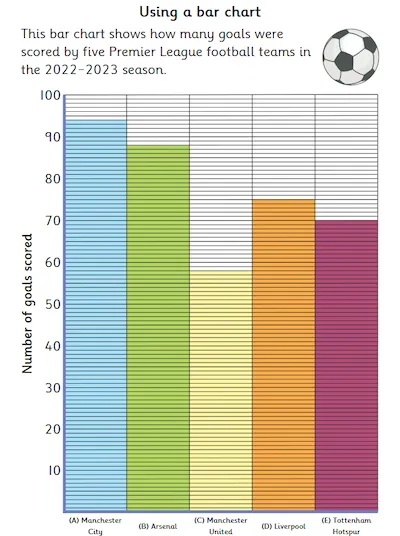
Being able to interpret a bar chart, sometimes known as a block graph or block diagram, is a vital early skill in getting to grips wth statistics. This double-page worksheet includes a bar chart based on real data and is straight-forward in that it shows a 1:1 scale on the y-axis. Students need to answer questions on the second page by referring to the bar chart.
An ink saving version is available, and an answer sheet is provided.
An ink saving version is available, and an answer sheet is provided.
- AGE
- 8-11 Years
- CATEGORIES
- Statistics
- LEARNING OBJECTIVES
- Solve comparison, sum and difference problems using information presented in bar charts.
