 Use a Bar Chart and Table to Interpret Information
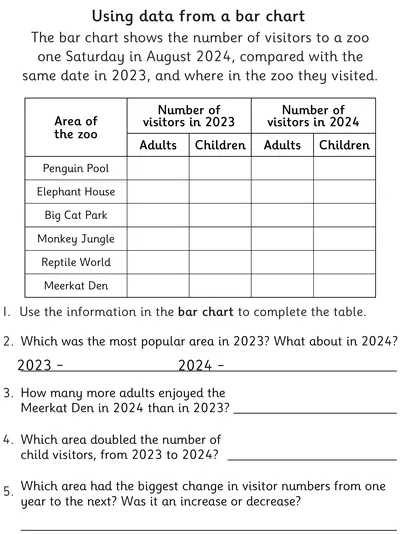
This double page resource includes a real-life data set, presented in a block graph, relating to the number of zoo visitors on a certain date on two consecutive years. The worksheet requires students to refer to the data sheet to answer the questions.
An answer sheet is provided.
An answer sheet is provided.
- AGE
- 8-10 Years
- CATEGORIES
- Statistics
- LEARNING OBJECTIVES
- Solve comparison, sum and difference problems using information presented in bar charts.
