 Interpreting Change in Temperature over Time
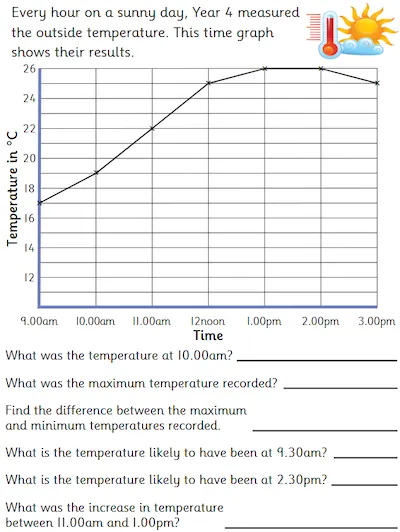
Students need to read and interpret the information on line graphs. This worksheet features a line graph which records temperatures over the course of several hours. This real-life situation provides an ideal opportunity to test student's understanding of data, such as changes over time, presented in graphical form.
An answer sheet is provided.
An answer sheet is provided.
- AGE
- 8-11 Years
- CATEGORIES
- Statistics
- LEARNING OBJECTIVES
- Solve comparison and difference problems using information presented in a line graph. Relate the graphical representation of data to recording change over time.
