 Completing a Bar Chart, Favourite Pizza Toppings
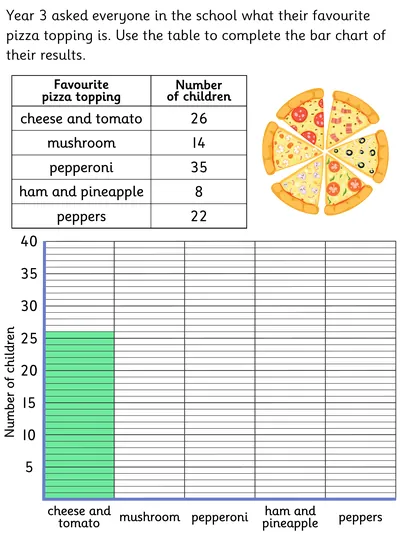
This worksheet requires children to interpret a table of data relating to pizza toppings. They then need to present the information on a bar chart. To do this accurately, children will need an understanding of scale as the y-axis numbering increases in steps of five.
An ink saving version is provided.
An ink saving version is provided.
- AGE
- 6-8 Years
- CATEGORIES
- Statistics
- LEARNING OBJECTIVES
- Interpret and present data using bar charts, pictograms and tables. Use simple scales.
