Topmarks Logo

Icon Statistics Worksheets

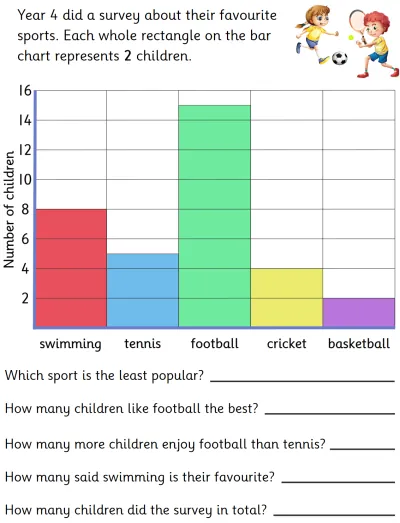
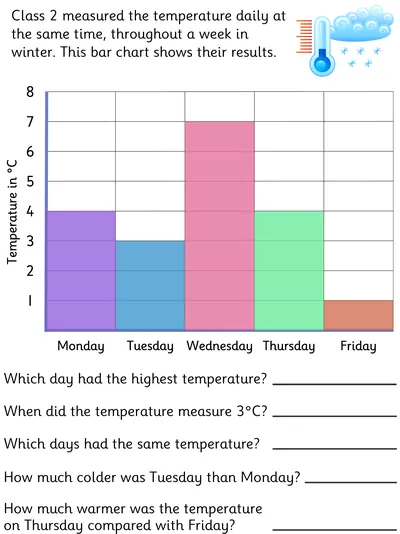
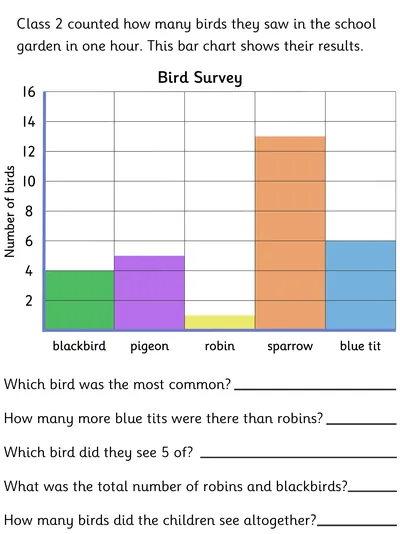
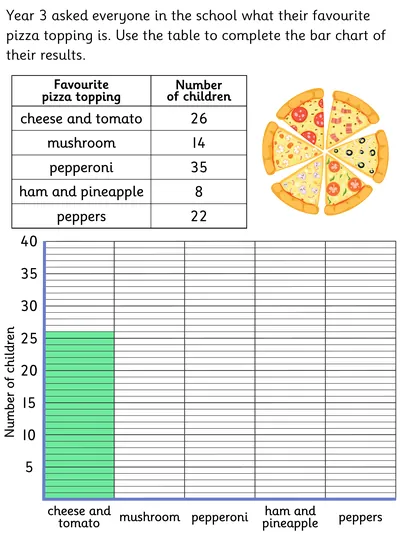
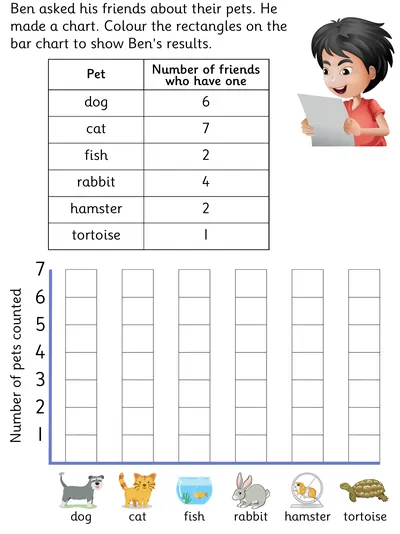
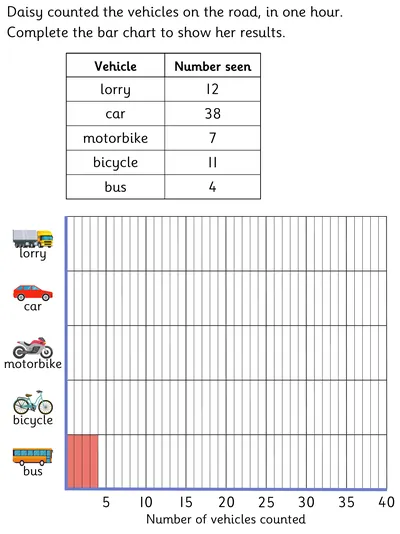
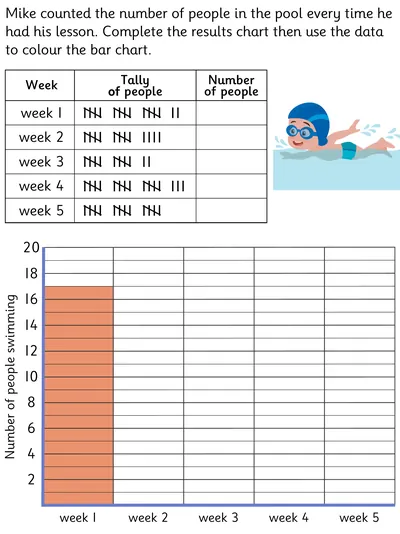
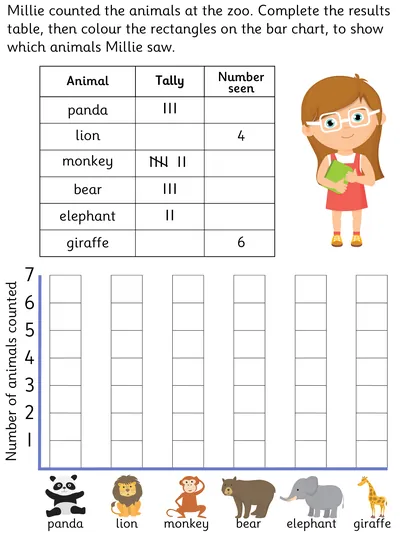
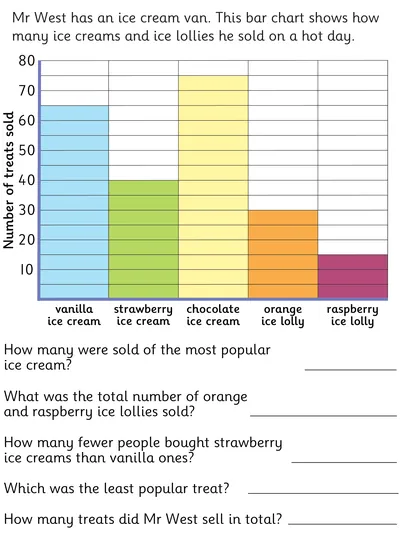
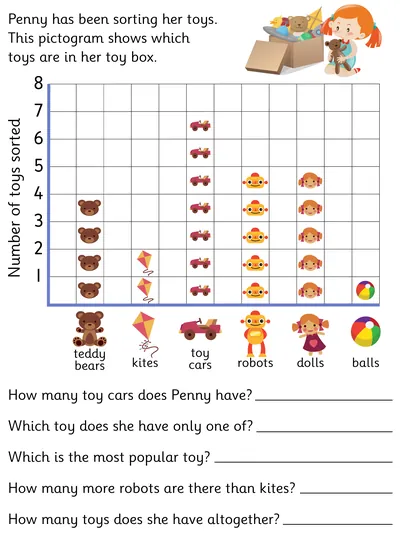
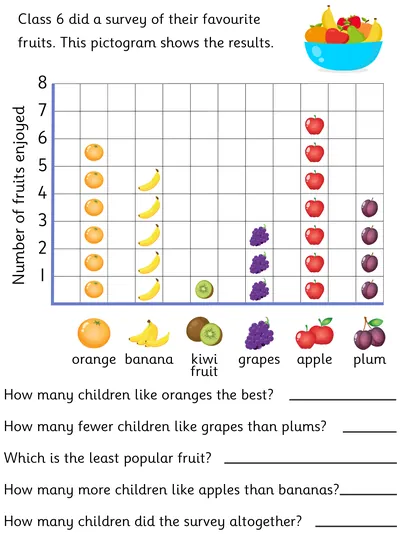
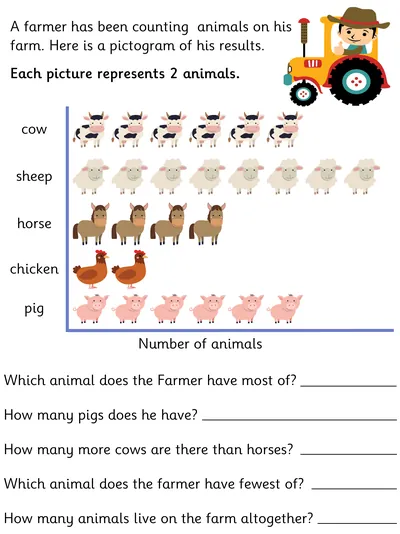
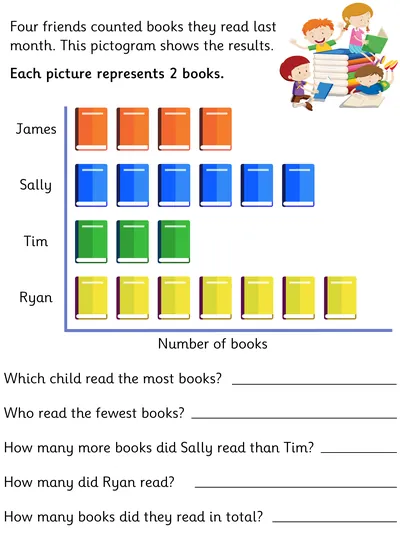
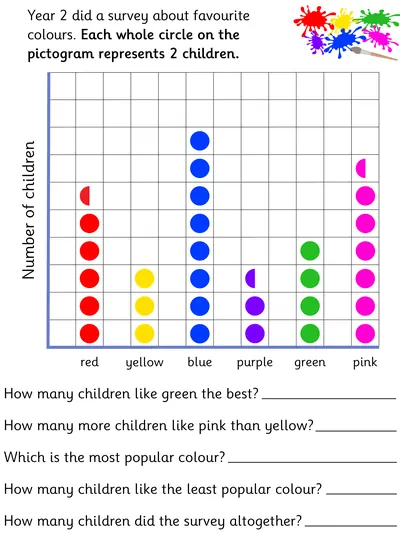
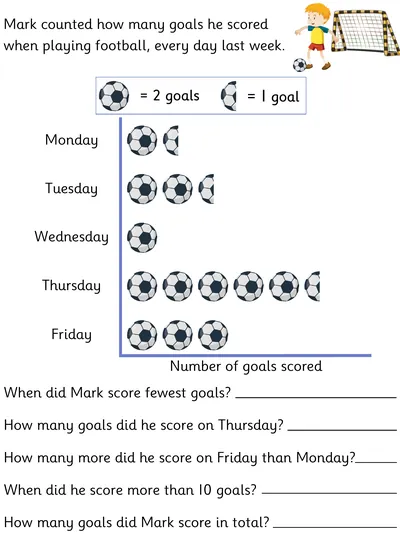
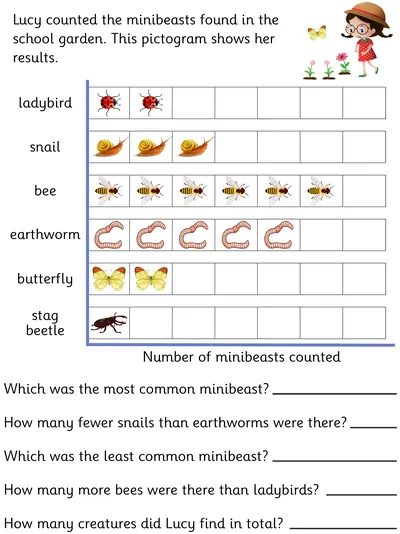
Year 2 statistics worksheets help children interpret and complete tally charts, bar charts, and pictograms. Activities build data handling skills through practical exercises, with ink-saving versions available for easy printing. These resources make learning to analyse and present information fun.

Interpreting a Bar Chart, Favourite Sports

A maths worksheet involving interpreting a bar chart about favourite sports. It can help young children who are learning how to read and interpret bar graphs.

Interpreting a Bar Chart, Summer Temperatures

A maths worksheet involving interpreting a bar chart about summer temperatures over 5 days. Students need to answer various questions about the data by reading and compare the columns.

Interpreting a Bar Chart, Winter Temperatures

A maths worksheet involving interpreting a bar chart about winter temperatures over 5 days. It provides and ideal introduction to reading and interpreting bar charts.

Interpreting a Bar Chart, Bird Survey

A maths worksheet involving interpreting a bar chart about a class bird survey over one hour.

Completing a Bar Chart, Favourite Pizza Toppings

A maths worksheet where students need to complete a bar chart about favourite pizza topics by using data presented in a table.

Completing a Bar Chart, Pets Theme

A maths worksheet where students need to use data about pets on a table to complete a bar chart.

Completing a Bar Chart, Transport Theme

A maths worksheet where students need to use data about vehicles counted in an hour, presented in a table, to complete a bar chart.

Complete the Tally and Bar Charts, Swimming Theme

A maths worksheet where students need to use data about swimmers in a pool presented on a tally chart to complete a bar chart.

Complete the Tally and Bar Charts, Zoo Theme

A maths worksheet where students need to complete missing data about zoo animals on tally and bar charts.

Interpreting a Bar Chart, Ice Cream Flavours

A maths worksheet where students need to read a bar chart about ice-cream sales and answer questions.

Interpreting a Pictogram, Toys Theme

An engaging worksheet requiring children to interpret the data represented in the pictogram by answering comparison, sum and difference questions about toys.

Interpreting a Pictogram, Favourite Fruits

An engaging worksheet requiring children to interpret the data represented in the pictogram by answering comparison, sum and difference questions about favourite fruits.

Interpreting a Pictogram, Farm Animals

An engaging worksheet requiring children to interpret the data represented in the pictogram, by answering comparison, sum and difference questions about farm animals.

Interpreting a Pictogram, Book Theme

An data handling worksheet focusing on interpreting data represented in a pictogram, by answering comparison, sum and difference questions about a book survey.

Interpreting a Pictogram, Favourite Colours

An data handling worksheet focusing on interpreting data represented in a pictogram, by answering comparison, sum and difference questions about a favourite colours survey.

Interpreting a Pictogram, Football Theme

An engaging worksheet focusing on interpreting data represented in a pictogram, by answering comparison, sum and difference questions about the number of goals scored over a week.

Interpreting a Pictogram, Minibeasts Theme

An engaging worksheet focusing on interpreting data represented in a pictogram, by answering comparison, sum and difference questions about the number of minibeasts counted in a school garden.