 Complete the Tally and Bar Charts, Swimming Theme
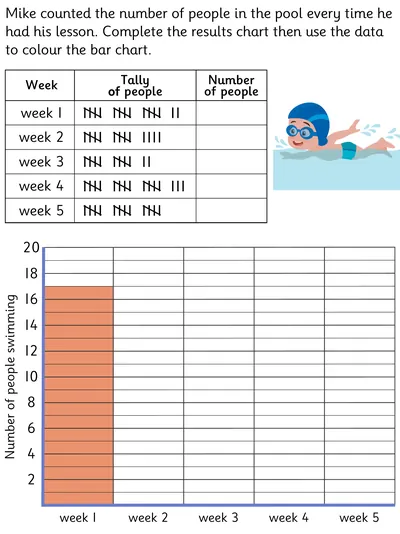
Children need to be able to understand tallying as a way of recording data. In this activity, they have to count the tally marks which represent the number of weekly swimmers and present this data on the bar chart below. Numbers on the y-axis increase in steps of two, so children need to be aware that blocks that are not numbered represent the odd numbers.
An ink saving version is available.
An ink saving version is available.
- AGE
- 6-8 Years
- CATEGORIES
- Statistics
- LEARNING OBJECTIVES
- Interpret and construct a bar chart.
