 Interpreting a Bar Chart, Ice Cream Flavours
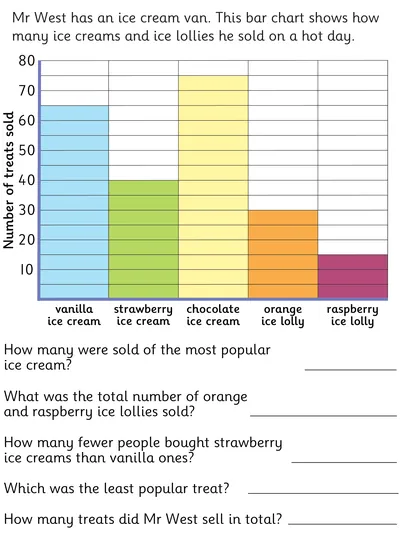
This is a straight-forward reading-of-a-bar-chart activity in which children need to answer questions about the data provided on a bar chart relating to ice-cream sales. Since the y-axis rises in fives but is only numbered in tens, children need to be able to read the scale accordingly.
An ink-saving version is available.
An ink-saving version is available.
- AGE
- 6-8 Years
- CATEGORIES
- Statistics
- LEARNING OBJECTIVES
- Interpret block diagrams and answer simple questions by counting the number of objects in each category.
