 Interpreting a Pictogram, Favourite Fruits
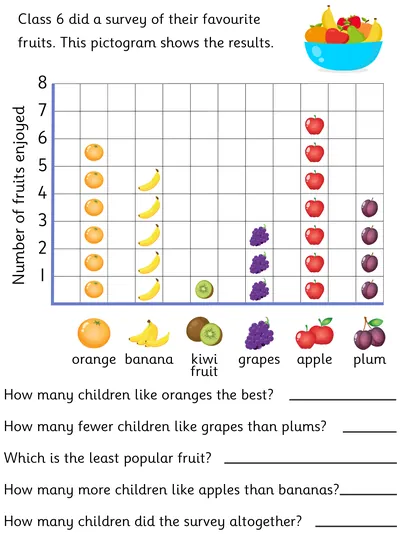
This worksheet is a simple pictogram in which one image represents one fruit on the y-axis. Children are required to interpret the pictogram through a series of one-step comparison, sum and difference questions.
- AGE
- 6-8 Years
- CATEGORIES
- Statistics
- LEARNING OBJECTIVES
- Answer simple questions by counting the number of objects in each category and sorting the categories by quantity. Answer questions about totalling and comparing categorical data.
