 Interpreting a Pictogram, Transport to School
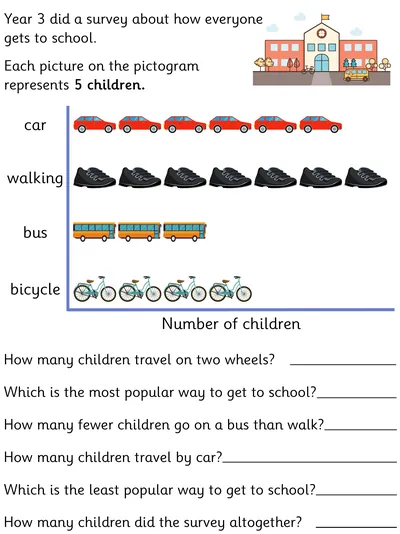
The theme of this pictogram is how a school year group are transported to school. The pictogram images are presented horizontally along the x-axis, and each one represents 5 children, so students will need to read the introduction carefully. Children are required to interpret the scaled pictogram through a series of one-step comparison, sum and difference questions.
An ink-saving version is available.
An ink-saving version is available.
- AGE
- 7-8 Years
- CATEGORIES
- Statistics
- LEARNING OBJECTIVES
- Interpret simple pictograms. Answer questions about totalling and comparing categorical data and use simple scales.
