Year Group: Year 3 (age 7-8) ▾ Select year group: Reception (age 4-5) Year 1 (age 5-6) Year 2 (age 6-7) Year 3 (age 7-8) Year 4 (age 8-9) Year 5 (age 9-10) Year 6 (age 10-11) Category: Statistics ▾ Select category: Counting Ordering Place Value Addition Subtraction Multiplication Division Money Fractions Geometry Measurement Statistics Statistics Worksheets 
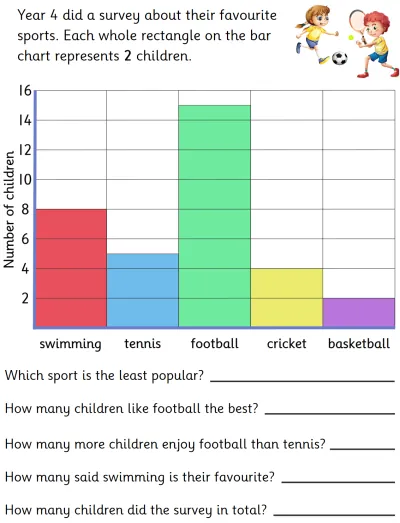
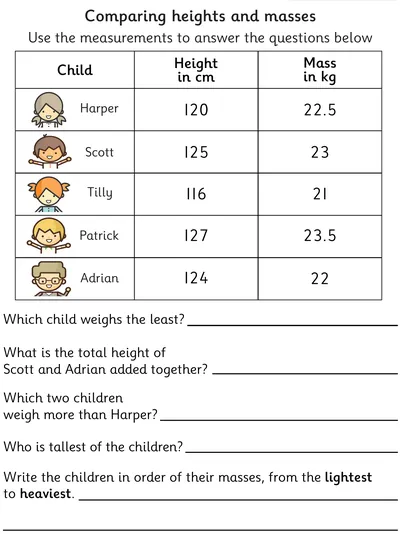
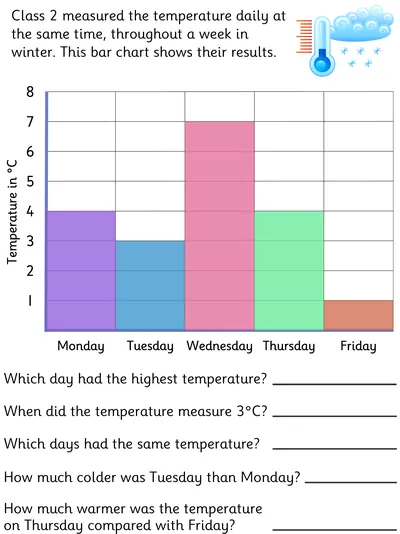
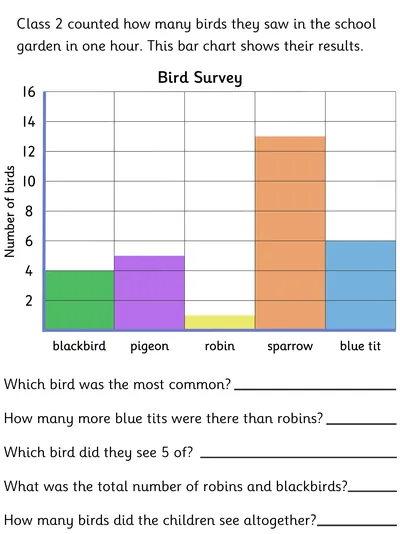
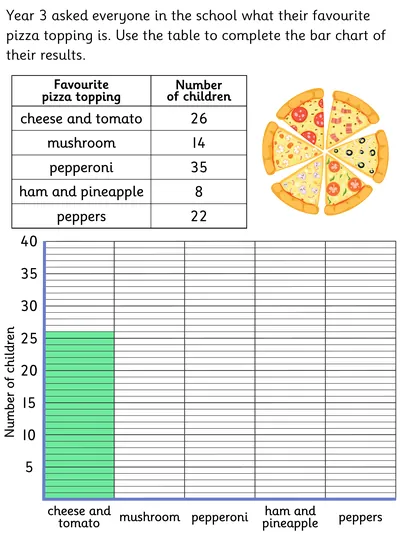
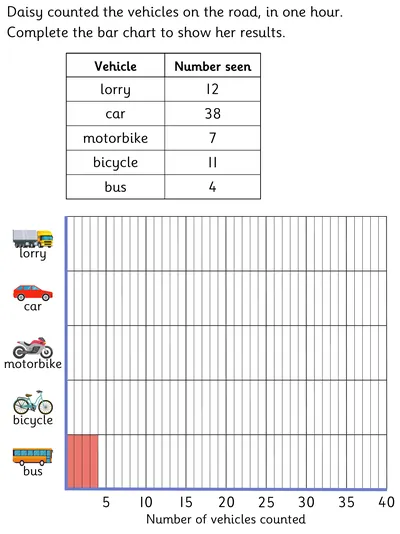
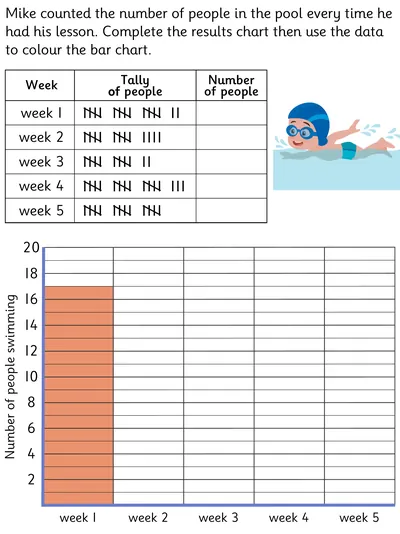
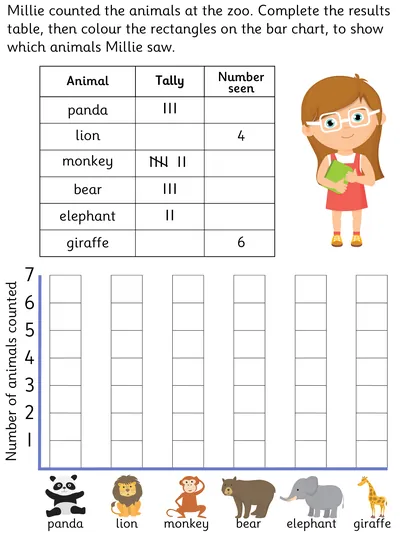
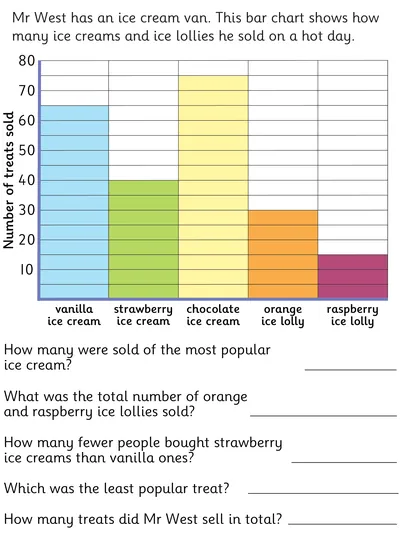
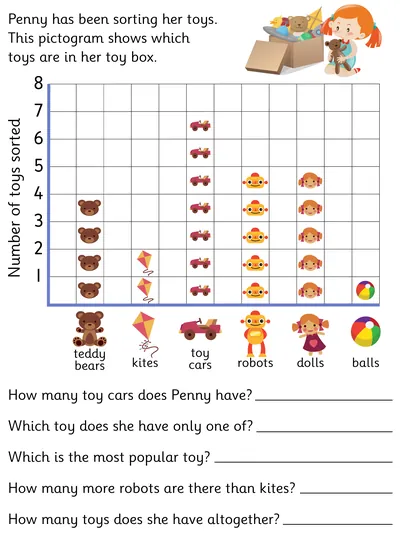
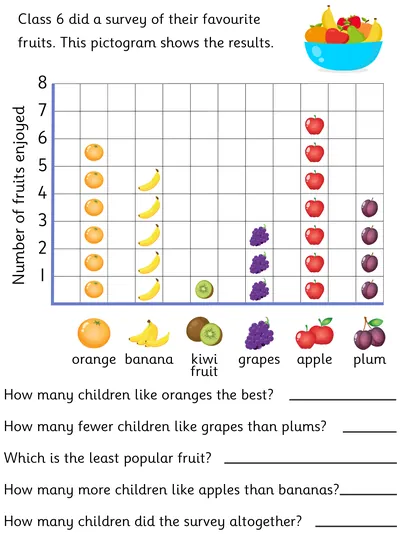
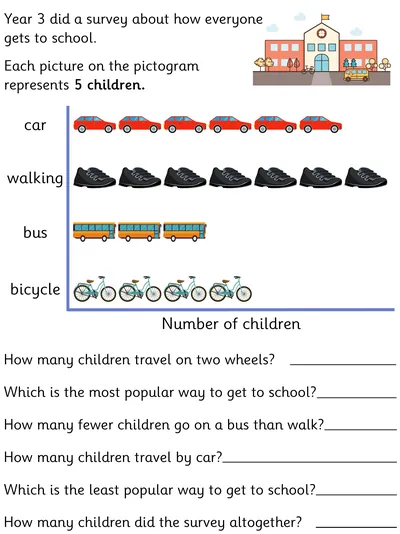
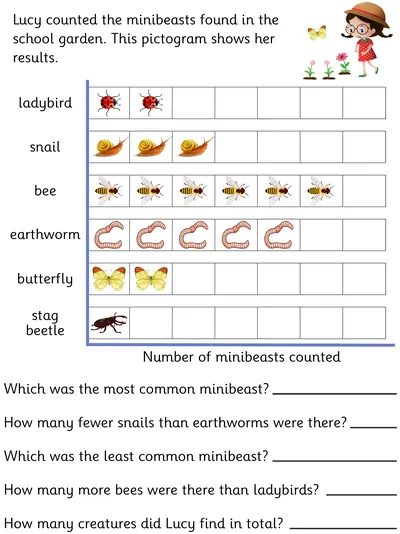
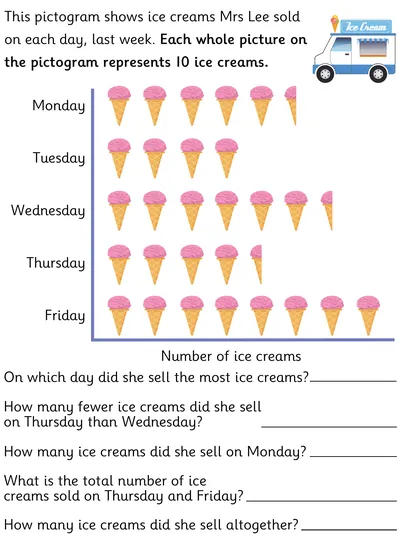
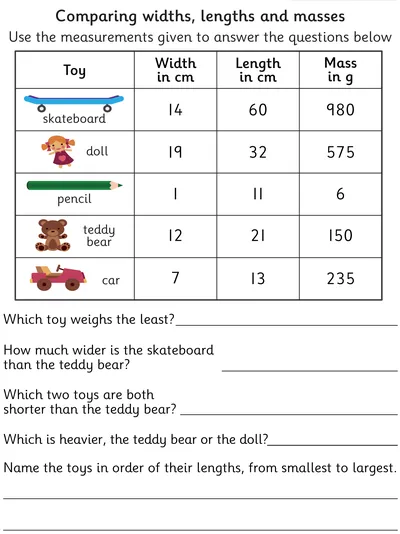
These statistics worksheets help children interpret and complete tables, pictograms, tally charts, and bar charts. Ideal for developing skills in handling data and drawing conclusions from visual and numerical representations. Interpreting a Bar Chart, Favourite Sports A maths worksheet involving interpreting a bar chart about favourite sports. It can help young children who are learning how to read and interpret bar graphs. Comparing Height and Mass in Context A worksheet with data in a table, about the height and mass of several children. Students need to interpret the data and answer one-step and two-step questions. Interpreting a Bar Chart, Summer Temperatures A maths worksheet involving interpreting a bar chart about summer temperatures over 5 days. Students need to answer various questions about the data by reading and compare the columns. Interpreting a Bar Chart, Winter Temperatures A maths worksheet involving interpreting a bar chart about winter temperatures over 5 days. It provides and ideal introduction to reading and interpreting bar charts. Interpreting a Bar Chart, Bird Survey A maths worksheet involving interpreting a bar chart about a class bird survey over one hour. Completing a Bar Chart, Favourite Pizza Toppings A maths worksheet where students need to complete a bar chart about favourite pizza topics by using data presented in a table. Completing a Bar Chart, Transport Theme A maths worksheet where students need to use data about vehicles counted in an hour, presented in a table, to complete a bar chart. Complete the Tally and Bar Charts, Swimming Theme A maths worksheet where students need to use data about swimmers in a pool presented on a tally chart to complete a bar chart. Complete the Tally and Bar Charts, Zoo Theme A maths worksheet where students need to complete missing data about zoo animals on tally and bar charts. Interpreting a Bar Chart, Ice Cream Flavours A maths worksheet where students need to read a bar chart about ice-cream sales and answer questions. Interpreting a Pictogram, Toys Theme An engaging worksheet requiring children to interpret the data represented in the pictogram by answering comparison, sum and difference questions about toys. Interpreting a Pictogram, Favourite Fruits An engaging worksheet requiring children to interpret the data represented in the pictogram by answering comparison, sum and difference questions about favourite fruits. Interpreting a Pictogram, Transport to School A worksheet requiring children to interpret data represented in a scaled pictogram, by answering comparison, sum and difference questions on a transport theme. Interpreting a Pictogram, Farm Animals An engaging worksheet requiring children to interpret the data represented in the pictogram, by answering comparison, sum and difference questions about farm animals. Interpreting a Pictogram, Book Theme An data handling worksheet focusing on interpreting data represented in a pictogram, by answering comparison, sum and difference questions about a book survey. Interpreting a Pictogram, Favourite Colours An data handling worksheet focusing on interpreting data represented in a pictogram, by answering comparison, sum and difference questions about a favourite colours survey. Interpreting a Pictogram, Football Theme An engaging worksheet focusing on interpreting data represented in a pictogram, by answering comparison, sum and difference questions about the number of goals scored over a week. Interpreting a Pictogram, Minibeasts Theme An engaging worksheet focusing on interpreting data represented in a pictogram, by answering comparison, sum and difference questions about the number of minibeasts counted in a school garden. Interpreting a Pictogram, Ice Cream Theme An engaging worksheet focusing on interpreting data represented in a pictogram, by answering comparison, sum and difference questions about ice cream sales over a week. Comparing Measurements of Toys A data handling worksheet with a table of data with measures of toys including their width, length and mass. Children need to solve problems by referring to the data. Share this