 Recording Change over Time
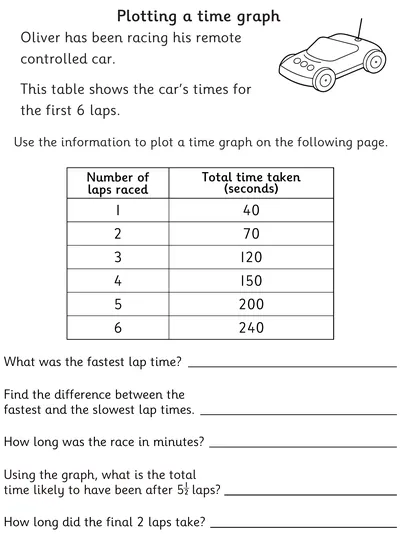
This two-page activity has data in a table that relates to the time taken for a toy car to complete laps of a track. Children need to plot a time graph using this data. They will then interpret both the table of information and their graph to answer various questions.
Answer sheets are provided.
Answer sheets are provided.
- AGE
- 9-11 Years
- CATEGORIES
- Statistics
- LEARNING OBJECTIVES
- Relate the graphical representation of data to recording change over time.
