Topmarks Logo

Icon Statistics Worksheets

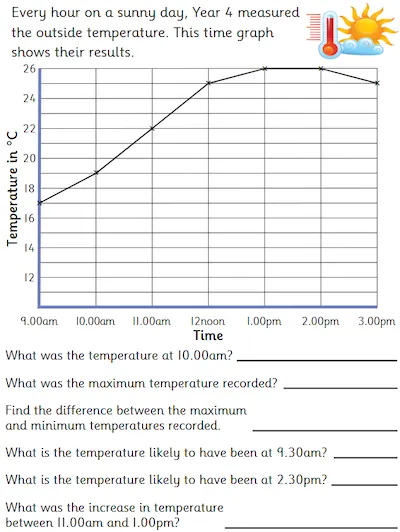
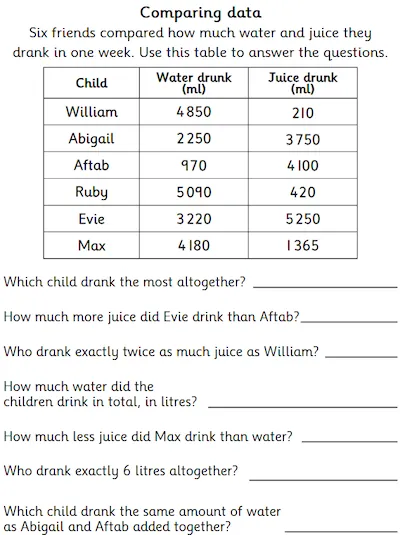
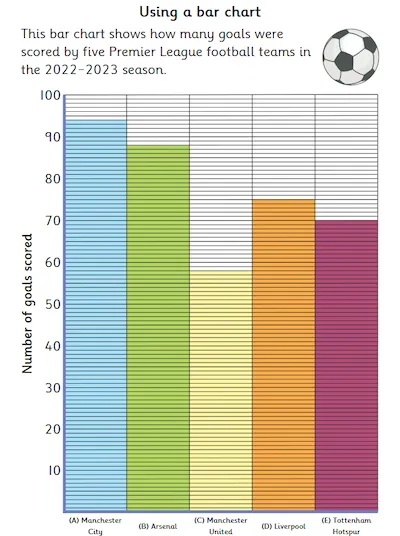
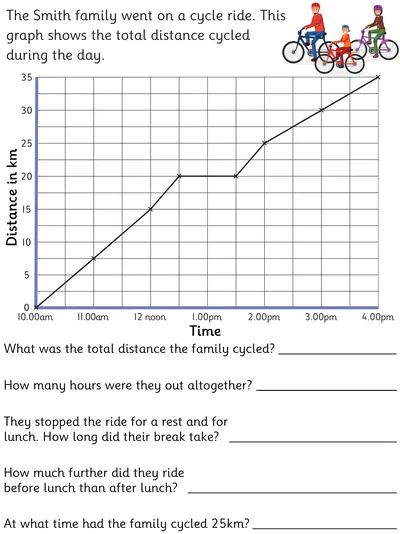
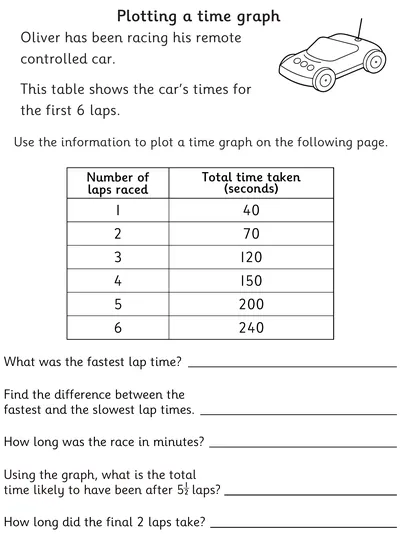
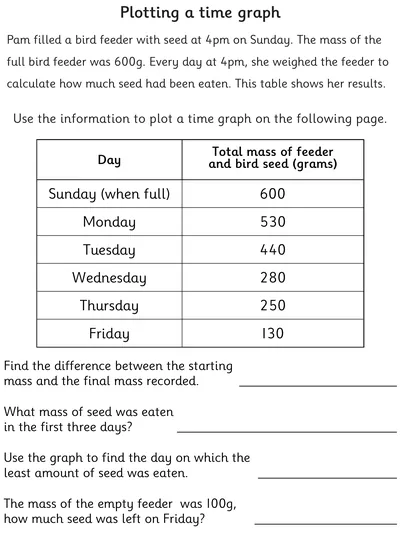
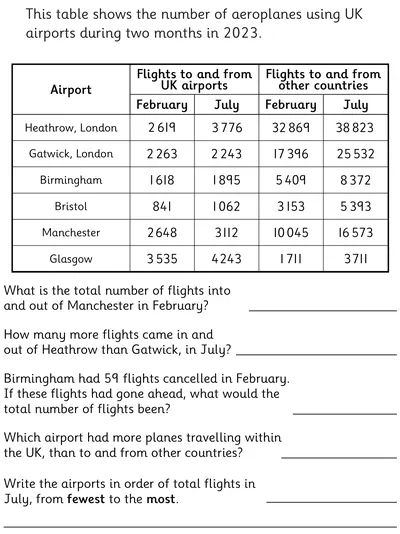
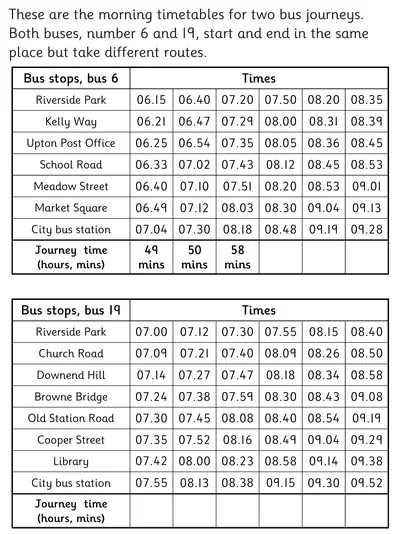
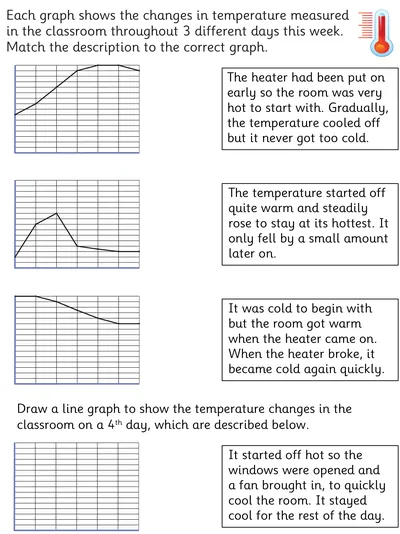
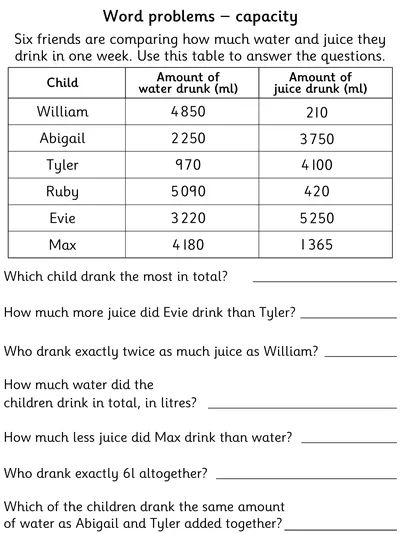
These statistics worksheets help learners build confidence in interpreting and using data across a range of formats. Activities include comparing and analysing line graphs, interpreting tables, bar charts, and bus timetables. Learners also practise recording changes over time by plotting points on line graphs to identify trends and patterns.

Interpreting Change in Temperature over Time

Consolidate data handling knowledge with this line graph worksheet based on temperature readings throughout a day in summer. This line graph has data recorded at hourly intervals.

Interpret Information in a Table - Capacity Theme

This data handling worksheet requires the interpretation of data collected, and presented in a table, about water drunk over a week and the answering of comparison questions.

Interpreting a Bar Chart, Football Theme

A double page maths worksheet where students need put their knowledge of interpreting a block graph about premier league goals into practice.

Interpreting Change in Distance over Time

Consolidate data handling skills with this line graph worksheet based on changes in distance over time during the course of a cycle ride.

Recording Change over Time

Consolidate data handling knowledge with this line graph worksheet which requires both plotting and interpreting data from a table.

Interpreting Change in Mass over Time

Consolidate data handling knowledge with this line graph worksheet which requires plotting a graph and interpreting data about the mass of seed eaten in a bird feeder over several days.

Interpret Information in a Table - Airport Theme

Consolidate data handling knowledge with this worksheet which requires interpreting and comparing data in a table about the air traffic in UK airports during February and July 2023.

Use and Interpret Timetables - Bus Theme

Consolidate data handling knowledge with this double-page worksheet which requires interpreting bus timetables and answering comparison questions based on the data.

Comparing and Interpreting Data in Line Graphs

This data handling worksheet requires students to recognise trends in data on line graphs relating to temperature readings.

Using Data to Solve Capacity Word Problems

A data handling worksheet involving a data set of capacity amounts which is a great tool for helping your students to access and interpret data