 Interpreting Change in Mass over Time
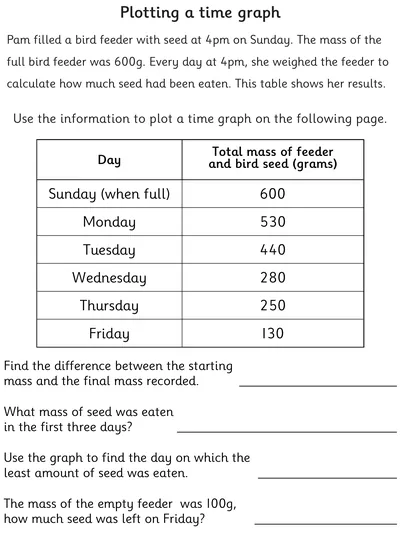
This two-page activity has statistics relating to the mass of bird seed eaten over six days. Students need to plot a time graph using given data. The graph introduces children to the concept of the y-axis starting at a figure other than zero. Pupils will then need to interpret both the table of information and their graph to answer various questions.
Answer sheets are provided.
Answer sheets are provided.
- AGE
- 9-11 Years
- CATEGORIES
- Statistics
- LEARNING OBJECTIVES
- Relate the graphical representation of data to recording change over time.
