 Interpret Information in a Table - Airport Theme
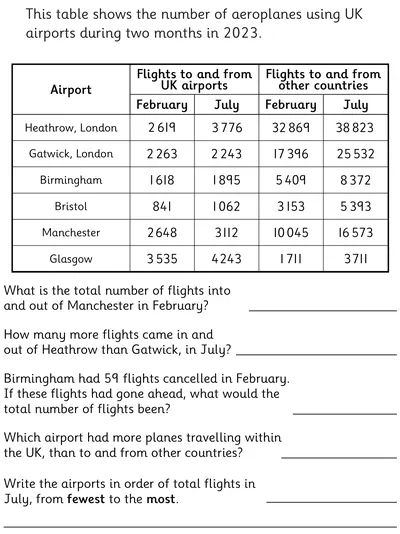
This interpreting data activity has statistics relating to air traffic into and out of UK airports. Students need to interpret the figures which represent air traffic over two individual months and solve comparison, sum and difference questions.
An answer sheet is provided.
An answer sheet is provided.
- AGE
- 9-11 Years
- CATEGORIES
- Statistics
- LEARNING OBJECTIVES
- Solve comparison, sum and difference problems using information presented in table.
