 Comparing and Interpreting Data in Line Graphs
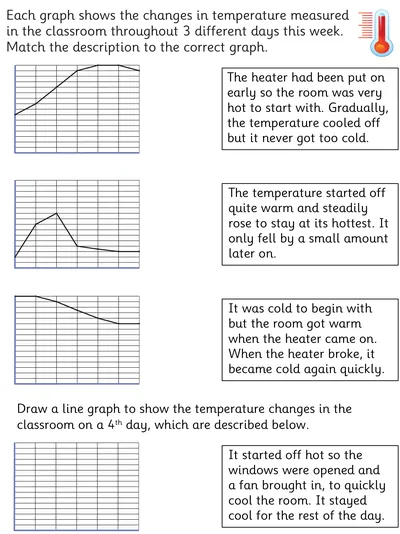
This data handling worksheet requires students to visualise trends in data on line graphs relating to temperature readings. Whilst each graph is incomplete in terms of precise temperatures, students are expected to recognise trends by the shape of the line graphs and also draw their own graph to match a description of temperature changes.
An answer sheet is provided.
An answer sheet is provided.
- AGE
- 9-11 Years
- CATEGORIES
- Statistics
- LEARNING OBJECTIVES
- Begin to relate the graphical representation of data to recording change over time.
