 Interpret Information in a Table - Capacity Theme
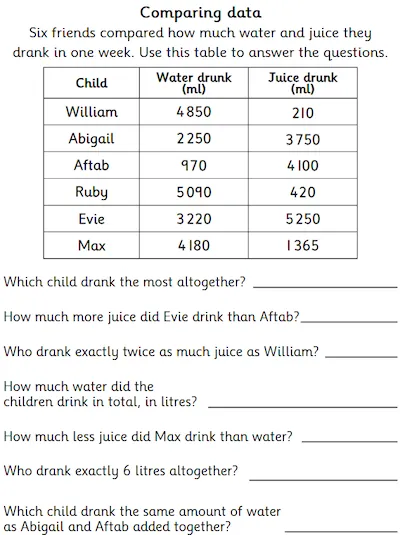
Being able to interpret data in a table is an important skill. This interpreting data activity involves a survey about water drunk by six people over a week. Students need to interpret the figures presented in a table to solve comparison, sum and difference questions relating to capacity.
An answer sheet is provided.
An answer sheet is provided.
- AGE
- 9-11 Years
- CATEGORIES
- Statistics
- LEARNING OBJECTIVES
- Solve comparison, sum and difference problems using information presented in a table.
